- Home
- News Releases
- Back Issues
- May FY2024
- Report Compiled on Results of FY2023 Survey on University-Developed Venture Businesses (Preliminary Report)
Report Compiled on Results of FY2023 Survey on University-Developed Venture Businesses (Preliminary Report)
- The number of such businesses shows record-high growth, while private universities as well show a significant leap -
May 15, 2024
The Ministry of Economy, Trade and Industry (METI) has compiled the Report on the Results of the FY2023 Survey on University-Developed Venture Businesses and hereby releases the preliminary report. The FY2023 survey revealed that the number of such venture businesses (VBs) was 4,288 as of October 2023, an increase of 506 from the 3,782 confirmed in FY2022, showing a record high for both the number of VBs and the increase. In the FY2023 survey, the number of VBs that private universities have developed shows a significant leap.
1. Purpose and background
University-developed VBs are expected to play a leading role in efforts to bring about innovation within the economy and society based on the results of innovative research in universities and other organizations. Through this survey, METI aims to conduct fixed-point observation of the establishment of university-developed VBs; examine business environments, demands and other elements; and analyze factors that may contribute to business growth and utilize the results to develop future policies.
2. Summary of the survey results
Changes in the number of university-developed VBs
The FY2023 survey reveals that the number of existing university-developed VBs was confirmed to be 4,288. This figure shows an increase of 506 from the 3,782 which was confirmed in the FY2022 survey, showing a record high for both the number of businesses and the increase.
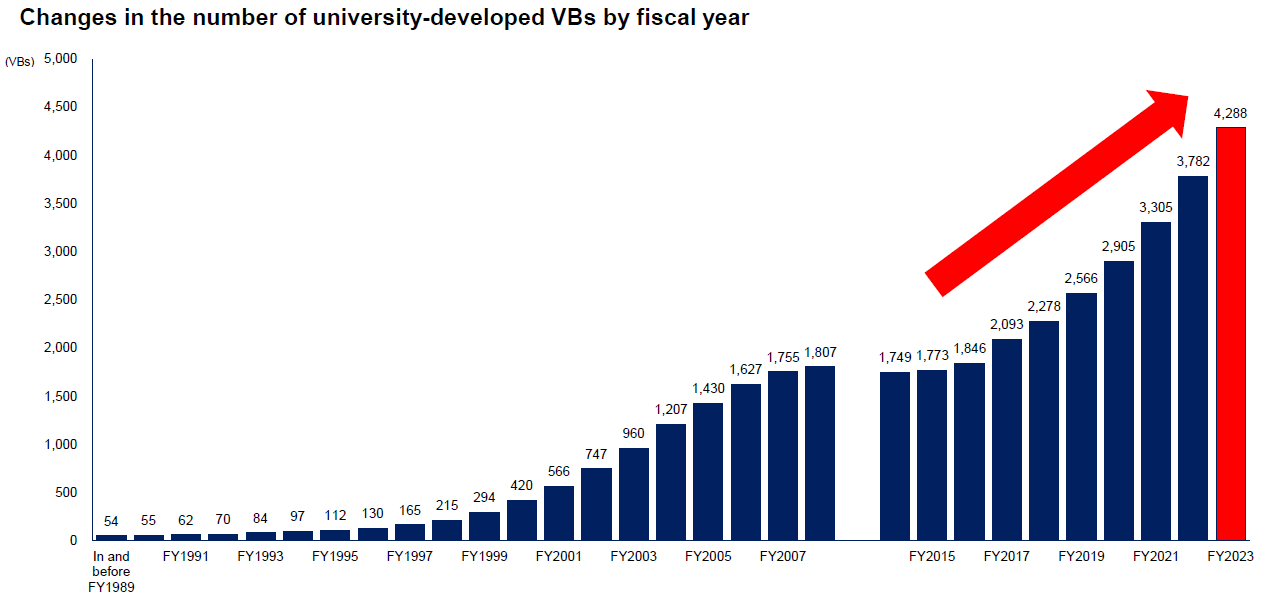
Note: This survey aggregated university-developed VBs that had been established as of the end of October 2023.
For this survey, VBs that fall into one or more of the following six categories are defined as university-developed VBs.
- Research-based VB: A newly established VB with the aim of commercializing patents and new technologies and business methods based on research results achieved at universities.
- Joint-research VB: A VB that has conducted joint research with a university within five years of its establishment in order to commercialize the technology and know-how of its founders. This includes those that had no special relationship with the university at the time of establishment.
- Technology-transfer VB: A VB that has undergone technology transfer from a university within five years of its establishment in order to maintain and develop an existing business. This includes those that had no special relationship with the university at the time of establishment.
- Student VB: A student VB that has a deep relationship with a university. This applies only to those in which current students are or were involved.
- Faculty-member VB: A faculty-member (e.g., faculty members, researchers, and postdoctoral fellows) VB that has a deep relationship with a university.
- Relation VB: A VB that has a deep relationship with a university (e.g., those funded by a university).
Number of newly established university-developed VBs per university
Following on from the FY2022 survey, the University of Tokyo still has the most university-developed VBs, while Osaka University showed an increase in the number of such VBs. In addition, the survey reveals a significant leap made by private universities, such as Keio University, Tokyo University of Science, and Ritsumeikan University. Moreover, it also shows that many universities are strongly focusing on the creation of new VBs.
|
Ranking (Ranking of the previous fiscal year) |
Name of university | FY2021 | FY2022 | FY2023 | Difference in number from the previous fiscal year |
|---|---|---|---|---|---|
| 1 (1) | University of Tokyo | 329 | 370 | 420 | +50 |
| 2 (3) | Keio University | 175 | 236 | 291 | +55 |
| 3 (2) | Kyoto University | 242 | 264 | 273 | +9 |
| 4 (5) | Osaka University | 180 | 191 | 252 | +61 |
| 5 (4) | University of Tsukuba | 178 | 217 | 236 | +19 |
| 6 (6) | Tohoku University | 157 | 179 | 199 | +20 |
| 7 (7) | Tokyo University of Science | 126 | 151 | 191 | +40 |
| 8 (9) | Waseda University | 100 | 128 | 145 | +17 |
| 9 (8) | Nagoya University | 115 | 137 | 143 | +6 |
| 10 (12) | Ritsumeikan University | 87 | 110 | 135 | +25 |
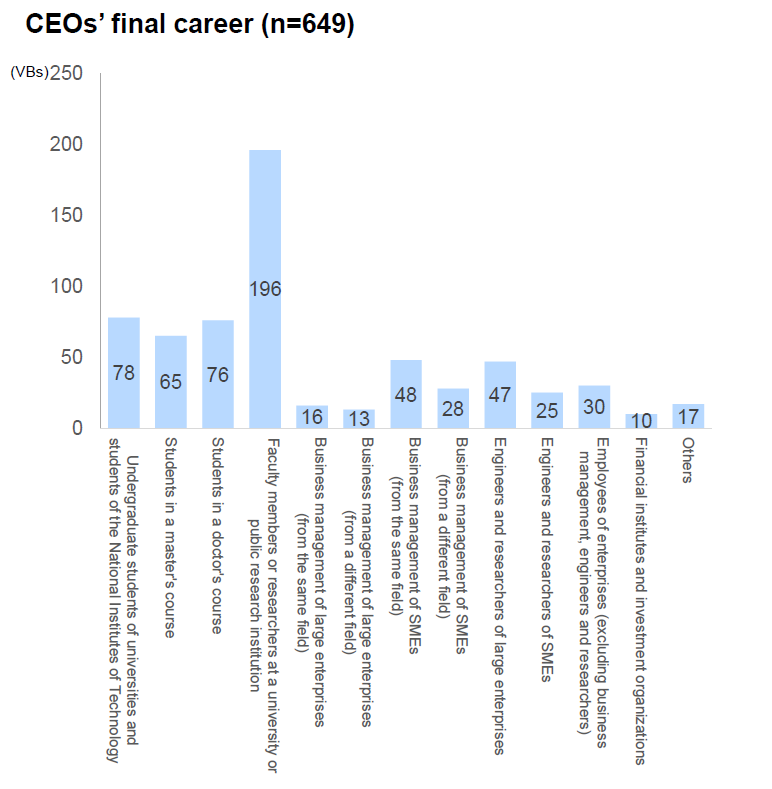
Analysis of management personnel in university-developed VBs
Concerning the final career of management personnel (CEO) in university-developed VBs before they took office as the CEO, "faculty member or researcher at a university or public research institute” marked the highest in number. This shows that in many cases, people from the academic sector are likely to become management personnel (CEO).
Analysis of the performance of human resources with a doctorate degree in university-developed VBs
The ratio of human resources with a doctorate degree among all employees of university-developed VBs by classification of university-developed VBs was higher, in particular, in technology-transfer VBs and faculty-member VBs. Moreover, the ratio of such human resources among all employees in university-developed VBs was higher than that among all researchers in ordinary companies. This shows that human resources with a doctorate degree are being actively utilized in university-developed VBs.
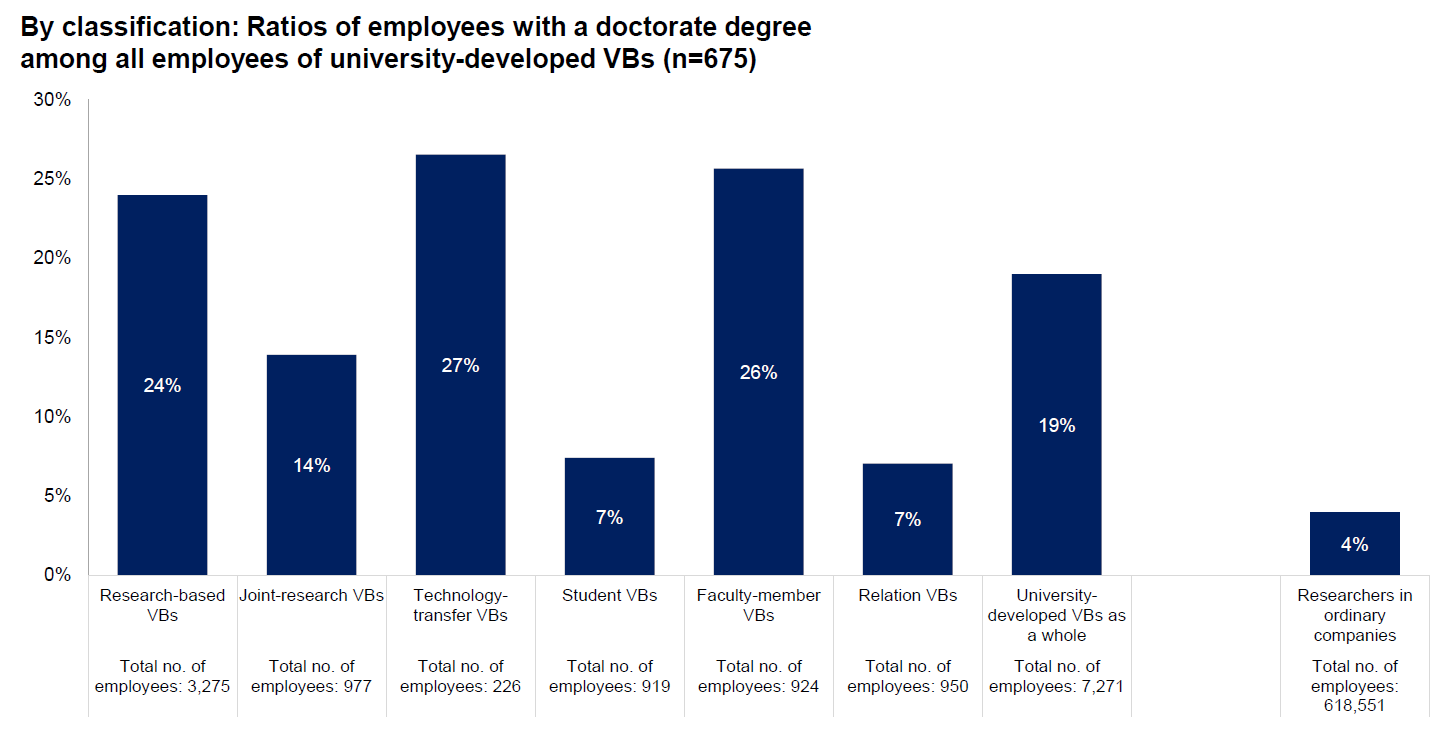
- Figure “n” in this item shows the number of target companies that were extracted and aggregated if they responded to “Currently working (as of October 1, 2023)” and “Classification” in the questionnaire items.
- The “total no. of employees” of university-developed VBs is the sum of the number of regular employees and that of non-regular employees.
- The data on the researchers in ordinary companies was aggregated based on the data in the Results of the FY2023 Survey of Research and Development (Statistics Bureau of Japan, Ministry of Internal Affairs and Communications).
3. Other information
Division in Charge
Industry-University Collaboration Office, Industrial Science, Technology and Environment Policy Bureau