- Home
- News Releases
- Back Issues
- August FY2025
- Results of FY2024 E-Commerce Market Survey Compiled
Results of FY2024 E-Commerce Market Survey Compiled
August 26, 2025
The Ministry of Economy, Trade and Industry (METI) conducted the FY2024 E-Commerce Market Survey to analyze the current state of the Japanese e-commerce (EC) market. It has now compiled the results into a report.
1.Summary of the research results
(1) Scale of the domestic EC market (business-to-consumer [B-to-C] and business-to-business [B-to-B])
In 2024, the scale of the domestic B-to-C EC market increased to 26.1 trillion yen (up by 5.1% from 24.8 trillion yen in the previous year, and 22.7 trillion yen in the year before). In addition, the scale of the domestic B-to-B EC market increased to 514.4 trillion yen (up by 10.6% from 465.2 trillion yen in the previous year, and 420.2 trillion yen in the year before).
The EC ratio1 was 9.8% (up by 0.4 percentage points year-over-year) for B-to-C EC and 43.1% (up by 3.1 percentage points year-over-year) for B-to-B EC, showing an increasing trend and continuous progress in the computerization of commercial transactions.
Changes in the scale of B-to-C EC market over time (unit: 100 million yen)
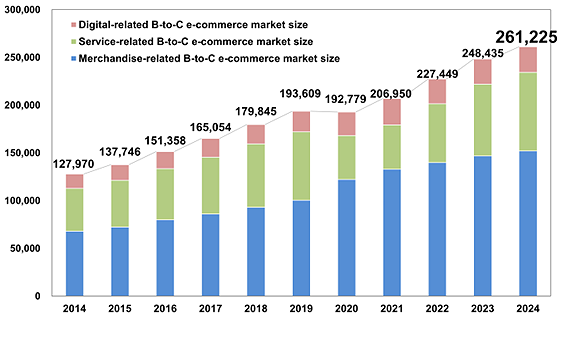
The scale of the B-to-C EC market by sector is as shown below.
Scale of B-to-C EC market and ratio of change by sector
| 2023 | 2024 | Ratio of change | |
|---|---|---|---|
| A. Merchandising sector | 14.6760 trillion yen (EC ratio: 9.38%) |
15.2194 trillion yen (EC ratio: 9.78%) |
3.70% |
| B. Service sector | 7.5169 trillion yen | 8.2256 trillion yen | 9.43% |
| C. Digital sector | 2.6506 trillion yen | 2.6776 trillion yen | 1.02% |
A.Merchandising sector
In the merchandising sector, food, drinks, and liquor (3.1163 trillion yen), domestic electrical appliances, AV equipment, and PCs and peripherals (2.7443 trillion yen), clothes and apparel goods (2.7980 trillion yen), and household goods, furniture, and interiors (2.5616 trillion yen) account for large shares. The respective totals of these top four categories all exceed 2 trillion yen.
The EC ratios were high for books and visual and music software (56.45%), domestic electrical appliances, AV equipment, PCs and peripherals (43.03%), and household goods, furniture, and interiors (32.58%).
Scale of the B-to-C EC market in the merchandising sector
| Classification | 2023 | 2024 | |||
|---|---|---|---|---|---|
| Market scale (100 million yen) * Below Y/Y change |
EC Ratio | Market scale (100 million yen) * Below Y/Y change |
EC Ratio | ||
| ① | Food, drinks, and liquor |
29,299
(up by 6.52%) |
4.29% |
31,163
(up by 6.36%) |
4.52% |
| ② | Domestic electrical appliances, AV equipment, and PCs and peripherals |
26,838
(up by 5.13%) |
42.88% |
27,443
(up by 2.26%) |
43.03% |
| ③ | Books and visual and music software |
18,867
(up by 3.54%) |
53.45% |
18,708
(down by 0.84%) |
56.45% |
| ④ | Cosmetics and pharmaceuticals |
9,709
(up by 5.64%) |
8.57% |
10,150
(up by 4.54%) |
8.82% |
| ⑤ | Household goods, furniture, and interiors |
24,721
(up by 5.01%) |
31.54% |
25,616
(up by 3.62%) |
32.58% |
| ⑥ | Clothes and apparel goods |
26,712
(up by 4.76%) |
22.88% |
27,980
(up by 4.74%) |
23.38% |
| ⑦ | Automobiles, motorcycles, and parts |
3,223
(up by 1.26%) |
3.64% |
3,336
(up by 3.50%) |
4.16% |
| ⑧ | Other |
7,391
(up by 0.87%) |
1.91% |
7,797
(up by 5.49%) |
2.08% |
| Total |
146,760
(up by 4.83%) |
9.38% |
152,194
(up by 3.70%) |
9.78% | |
B.Service sector
In the service sector, travel services (3.5249 trillion yen) accounted for the largest share. Following on from the previous year and the year before, the market scales of travel services, eating and drinking services, and financial services dramatically recovered in 2024, after the sharp drop due to the COVID-19 pandemic.
Scale of the B-to-C market in the service sector
| Classification | 2023 | 2024 | |
|---|---|---|---|
| Market scale (100 million yen) *Below Y/Y change |
Market scale (100 million yen) *Below Y/Y change |
||
| ① | Travel services |
31,953
(up by 35.87%) |
35,249
(up by 10.32%) |
| ② | Eating and drinking services |
8,165
(up by 23.68%) |
9,692
(up by 18.70%) |
| ③ | Ticket sales |
6,658
(up by 19.30%) |
7,061
(up by 6.05%) |
| ④ | Financial services |
8,483
(up by 12.25%) |
9,890
(up by 16.59%) |
| ⑤ | Beauty services |
6,854
(up by 11.65%) |
7,302
(up by 6.54%) |
| ⑥ | Food delivery services |
5,868
(up by 10.72%) |
5,442
(down by 7.26%) |
| ⑦ | Other (medical services, insurance, housing-related services, and education, etc.) |
7,189
(up by 6.00%) |
7,621
(up by 6.01%) |
| Total |
75,169
(up by 22.27%) |
82,256
(up by 9.43%) |
|
C.Digital sector
In the digital sector, online games (1.2553 trillion yen) accounted for the largest share. However, the market scale remained nearly flat compared to the previous year, with a decrease of 0.58% year-over-year.
Scale of the B-to-C EC market in the digital sector
| Classification | 2023 | 2024 | |
|---|---|---|---|
| Market scale (100 million yen) * Below Y/Y change |
Market scale (100 million yen) * Below Y/Y change |
||
| ① | Electronic publications (e-books and e-magazines) |
6,683
(up by 6.87%) |
6,722
(up by 0.58%) |
| ② | Paid music distribution |
1,165
(up by 13.87%) |
1,233
(up by 5.84%) |
| ③ | Paid video distribution |
4,717
(up by 8.20%) |
4,873
(up by 3.31%) |
| ④ | Online games |
12,626
(down by 3.60%) |
12,553
(down by 0.58%) |
| ⑤ | Other |
1,316
(up by 6.00%) |
1,395
(up by 6.00%) |
| Total |
26,506
(up by 2.05%) |
26,776
(up by 1.02%) |
|
(2) Scale of the domestic EC market (consumer-to-consumer [C-to-C])
In recent years, the C-to-C EC market2 has been dramatically expanding as an EC channel. In light of this trend, METI has been estimating the scale of the market in Japan since the 2016 survey.
The scale of the C-to-C EC market in 2024 is estimated to be 2.5269 trillion yen (up by 1.82% year-over-year).
Estimated scale of C-to-C-EC market
| 2023 | 2024 | Growth rate | |
|---|---|---|---|
| C-to-C-EC | 2.4817 trillion yen | 2.5269 trillion yen | 1.82% |
(3) Market scale of cross-border EC between Japan, the U.S., and China
In 2024, the market scale of cross-border EC between Japan, the U.S., and China increased in all three countries. In particular, the amount purchased through cross-border EC by Chinese consumers from Japanese business operators was 2.6372 trillion yen (up by 8.5% year-over-year) and 3.1397 trillion yen from U.S. business operators (up by 6.0% year-over-year), continuing the previous year's increasing trends.
Scale of cross-border EC between Japan, the U.S., and China
| Country | Amount purchased through cross-border EC | Growth rate |
|---|---|---|
| Japan | 441 billion yen | 4.8% |
| U.S. | 2.7144 trillion yen | 7.3% |
| China | 5.7769 trillion yen | 7.2% |
2. Outline of the E-Commerce Market Survey
This survey has been conducted every year since FY1998 with the aim of discovering the trends in the EC market and the current situation regarding its users. This was the 27th survey.
In addition to the domestic market scale of business-to-consumer, business-to-business, and consumer-to-consumer EC, the survey has also been investigating the market trends in B-to-C cross-border EC (between Japan, the U.S., and China).
Notes:
- The EC ratio in this survey refers to the ratio of the e-commerce market scale to the total amount for all commercial transactions. The EC ratios are calculated based on merchandising businesses in the case of B-to-C EC, and on the business types not in the industrial classification category "Other" in the case of B-to-B EC.
See the document below for more details about the survey. - For C-to-C transactions, the survey does not only consider ones between individuals but also includes B-to-B and B-to-C transactions, and the value for the market scale includes these as well.
Related Material
Division in Charge
Digital Economy Division, Commerce and Information Policy Bureau