- Home
- News Releases
- Back Issues
- March FY2026
- 2025 Ratio of Cashless Payment Among the Total Amount Paid by Consumers Calculated
2025 Ratio of Cashless Payment Among the Total Amount Paid by Consumers Calculated
The ratio was 58.0%, showing a steady increase toward the achievement of the 2030 goal
March 31, 2026
Aiming to achieve the long-term goal of raising the ratio of cashless payment among the total amount paid by consumers (hereinafter referred to as the “cashless payment ratio”) to 80%, as well as the 2030 interim goal of increasing the ratio to 65%, the Ministry of Economy, Trade and Industry (METI) has been advancing efforts related to promoting such payment in collaboration with related ministries and agencies. As part of the efforts, METI has been calculating and publicizing cashless payment ratios on a regular basis.
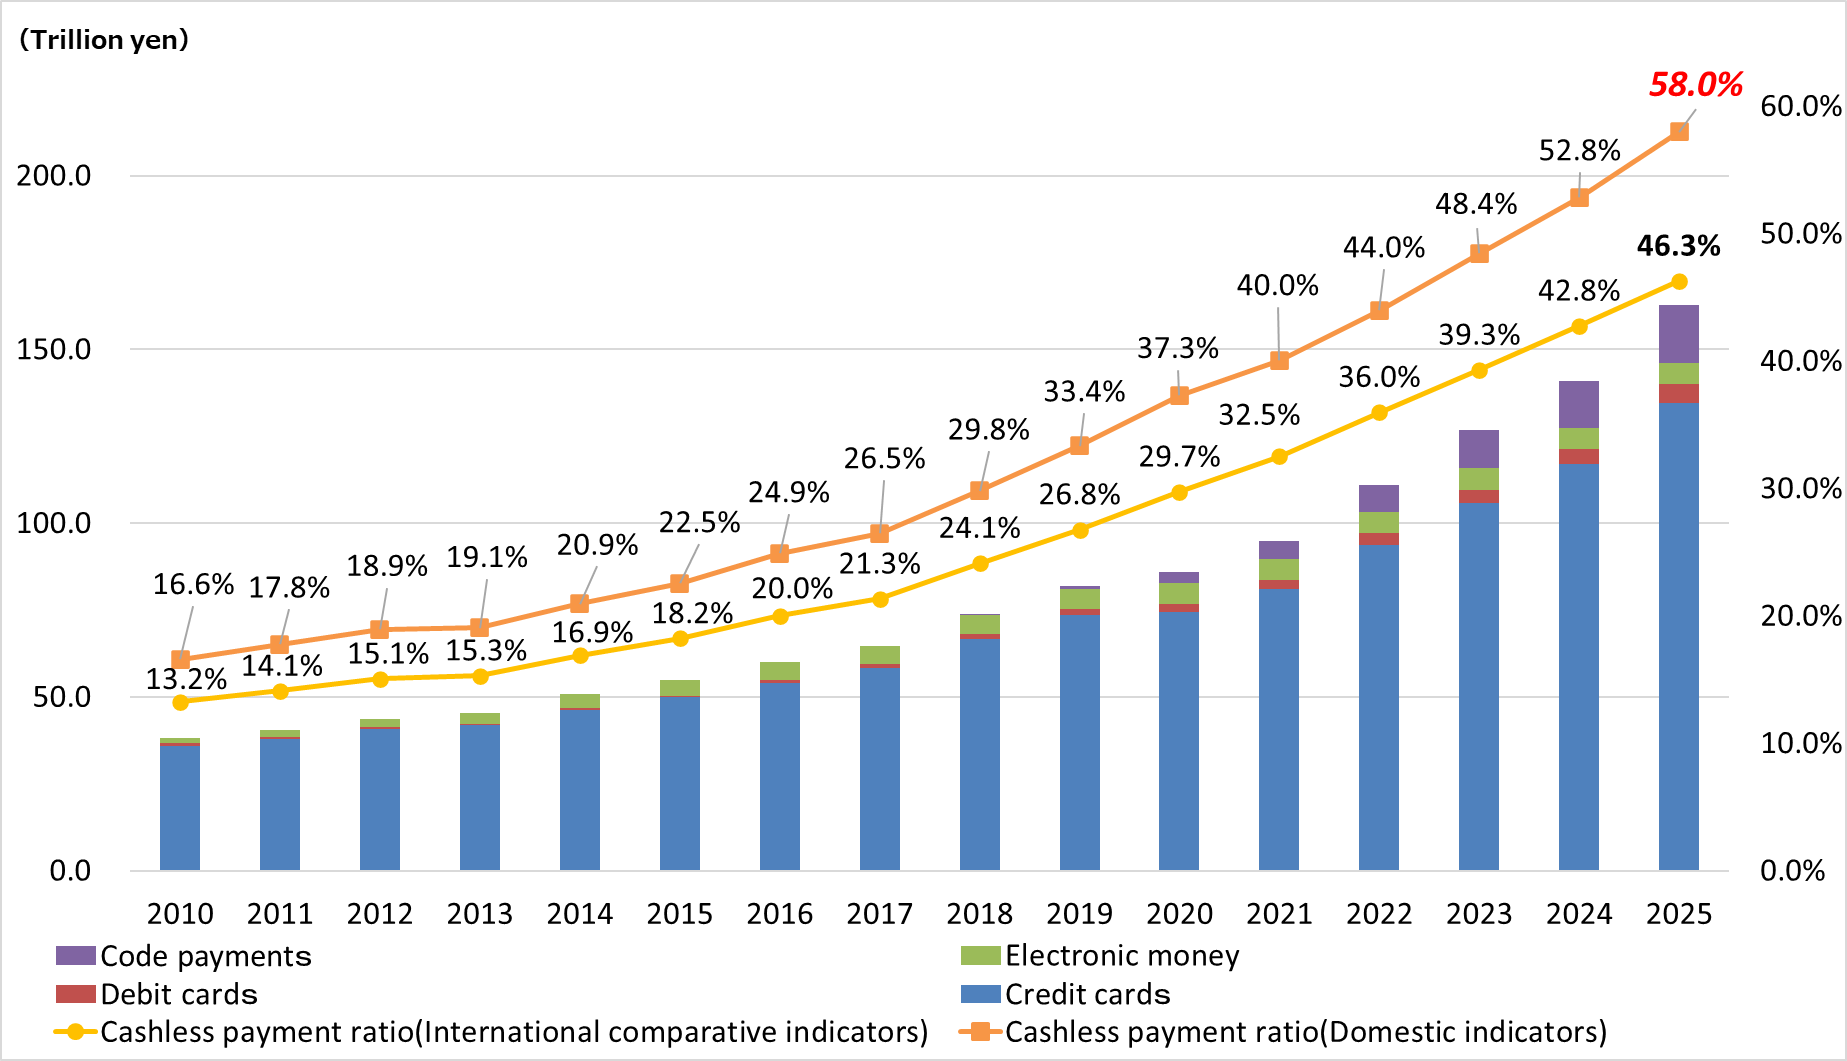
The cashless payment ratio in 2025 steadily increased to 58.0%.
1. Overview of the calculation results
In 2025, the cashless payment ratio steadily increased to 58.0% (162.7 trillion yen). Breaking down the 58% ratio, credit cards accounted for 82.7% (134.6 trillion yen), debit cards for 3.4% (5.5 trillion yen), electronic money for 3.7% (6.0 trillion yen), and code payments for 10.2% (16.6 trillion yen).
Changes in the cashless payment amount and cashless payment ratios in Japan (2025)
Changes in the breakdown of the cashless payment amount and cashless payment ratios by payment method
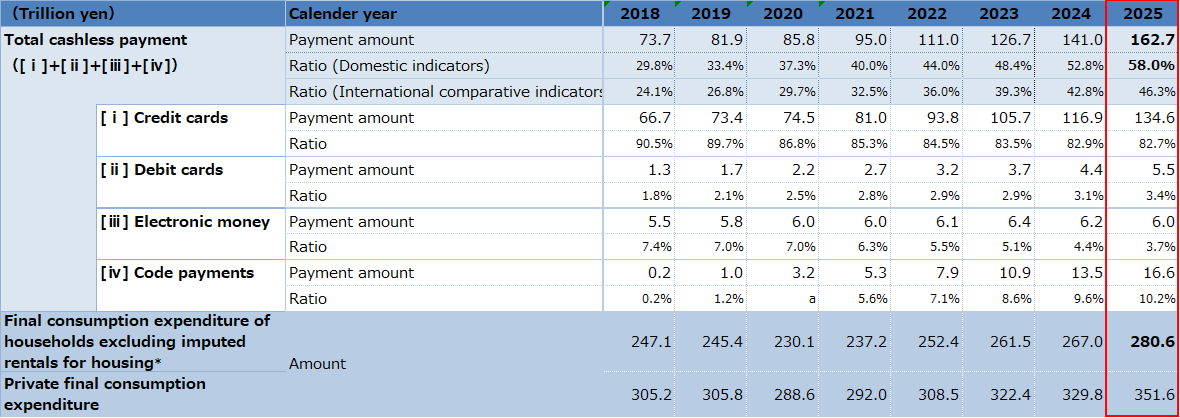
* The basis for the national accounts was revised in 2020, and this revised basis has been applied to figures published from December 2025 onwards. As a result, housing rentals, including imputed rent for housing, have been revised upward retroactively. Therefore, figures prior to 2024 also use the second preliminary national accounts estimate for the October-December 2025 quarter.
Reference 1: Government goals
In light of the achievement of the government goal of increasing the cashless payment ratio to around 40% by 2025, METI convened the Cashless Promotion Study Group and published a summary of its discussions in December 2025. The summary indicated that the goals for the period after 2025 would be as follows.
Summary of Discussions of the Cashless Promotion Study Group (Excerpt) [Published in December 2025]
- With regard to the long-term goal of achieving an 80% cashless payment ratio, the international comparison indicator includes imputed rents for owner-occupied housing and other related housing items in the total, amounting to approximately 57 trillion yen (equivalent to approx. 17%). Accordingly, the goal is set as an “80% cashless payment ratio based on the domestic indicator,” with the aim of achieving this goal as early as possible.
- The interim (2030) goal is set at 65% based on the domestic indicator, which represents a midpoint level between the 2024 actual result and the long-term goal (55% based on the international comparison indicator*).
* This goal accounted for the fact that, in actual results for the period from 2020 to 2024, the domestic indicator was approximately 8–9 percentage points higher than the international comparison indicator.
Reference 2: International comparison indicator
The Cashless Promotion Study Group reviewed the indicator to better reflect actual consumer experience, and decided, from the perspective of continuity with past data and international comparability, to continue using the indicator applied until 2024 as the international comparison indicator.
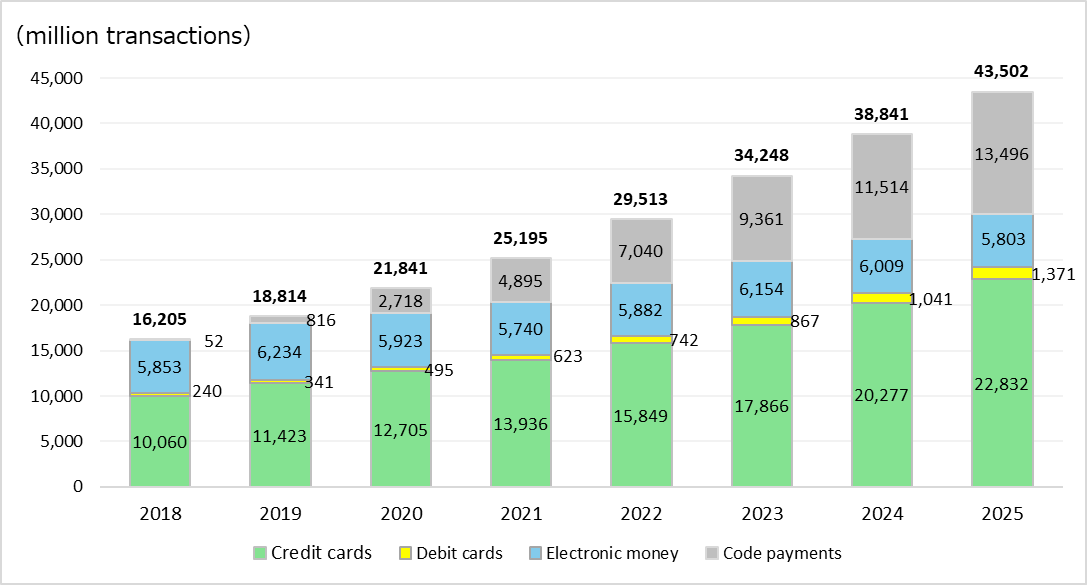
Reference 3: Number of cashless payment transactions
The number of cashless payment transactions may be useful for measuring progress in terms of social significance, such as improved consumer convenience and enhanced operational efficiency for merchants; however, the total number of transactions including cash is difficult to determine. Therefore, the Cashless Promotion Study Group decided to publish the number of transactions as reference information.
Number of payment transactions by cashless payment method (million transactions)
Data sources
- Credit cards:
Credit Card Transaction Survey released by the Japan Consumer Credit Association
Note: Based on survey results from major credit card companies (26 companies) - Debit cards and electronic money:
Payment and Settlement Statistics released by the Bank of Japan - Code payments:
Trends in Use of Code Payment released by the Payments Japan Association
Note: There may be overlaps between credit cards and code payments.
(For example, if a payment is made using a code payment service linked to a credit card, it is counted for both credit cards and code payments.)
2. Calculation method
After the release of the previous year’s results from certain data sources, as an indicator of progress in cashless payment dissemination, METI, on the basis of the calendar year data, has been calculating and publicizing the cashless payment ratio every year based on the following formula.
Domestic indicator

Data sources
*1 Japan Consumer Credit Association (JCA)
Note: Up to 2012, METI used estimates based on the results of questionnaire surveys that JCA conducted targeting credit card companies as JCA members, while from 2013, METI has been using actual values registered in designated credit information organizations.
*2 Japan Electronic Payment Promotion Organization (until 2015); and Payment and Settlement Systems Report and Payment and Settlement Statistics, which are released by the Bank of Japan (from 2016)
*3 Payment and Settlement Statistics released by the Bank of Japan
*4 Trends in Use of Code Payments released by the Payments Japan Association
Note: Excluding payments made using code payment services linked to credit cards and branded debit cards, and amounts charged from credit cards and branded debit cards.
*5 National Accounts of Japan (nominal values) released by the Cabinet Office
Note: As the 2020 benchmark revision of the National Accounts has been applied to figures published from December 2025 onward, housing rents, including imputed rents for owner-occupied housing, were revised upward retroactively. Accordingly, figures for 2024 and earlier are based on the second preliminary estimate for the October–December 2025 quarter.
International comparison indicator

Data sources
*1 Japan Consumer Credit Association (JCA)
Note: Up to 2012, METI used estimates based on the results of questionnaire surveys that JCA conducted targeting credit card companies as JCA members, while from 2013, METI has been using actual values registered in designated credit information organizations.
*2 Japan Electronic Payment Promotion Organization (until 2015); and Payment and Settlement Systems Report and Payment and Settlement Statistics, which are released by the Bank of Japan (from 2016)
*3 Payment and Settlement Statistics released by the Bank of Japan
*4 Trends in Use of Code Payments released by the Payments Japan Association
Note: Excluding payments made using code payment services linked to credit cards and branded debit cards, and amounts charged from credit cards and branded debit cards.
*5 National Accounts of Japan (nominal values) released by the Cabinet Office
Related Links
- 2024 Ratio of Cashless Payment Among the Total Amount Paid by Consumers Calculated
- Cashless Promotion Study Group (in Japanese)
Division in Charge
Commerce and Consumer Affairs Policy Division, Commerce and Service Industry Policy Group