

- Statistics

- Quarterly Survey of Japanese Business Activities

- Quarterly Survey of Japanese Business Activities (July-September 1997)

- 5. Status of Overseas Subsidiaries by region
Quarterly Survey of Overseas Subsidiaries
5. Status of Overseas Subsidiaries by region
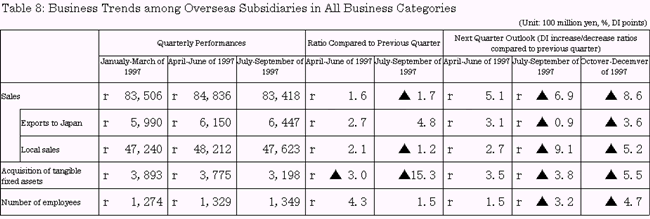
In North America, the reduction of sales in the transportation equipment sector was remarkable and the reduction of sales in the current quarter was also greater than in the other regions. It was worth noticing that the October-December outlook for the forthcoming sales in this transportation equipment sector forecast a significant improvement ahead.
In ASEAN 4, almost all the industrial sectors suffered significant decreases in sales in the current quarter compared to the previous quarter as represented by the remarkable decline in the transportation equipment sector, registering a 6.6% decline on a total basis. The October-December quarter outlook for future sales emerged with a poor DI forecast, namely the DI index showed minus 24 points compared to the previous quarter. The predicted decline of sales in ASEAN 4 in the coming quarter was the greatest in comparison with other regions. By country, the declined sales in Thailand affected greatly the overall business performances in this region.
In NIES 3 countries, locally-based overseas subsidiaries registered increased sales in contrast to the worsened business outcome of their counterparts in ASEAN 4 countries. From the point of view of Asia as a whole, however, locally-based overseas subsidiaries of Japanese origin suffered slightly decreased sales of 1.1% compared to the previous quarter.
In Europe, declined sales in the transportation equipment sector negatively contributed to an overall declined performance in comparison with the previous favorable performance. However, Europe was the only region where the number of companies that predicted growth in sales in the next quarter increased.
- (1) North America
- (2) Asean 4
- (3) Nies 3
- (4) China and Other Asian Countries
- (5) Europe
(1) North America
(a) Turnover and Local Sales
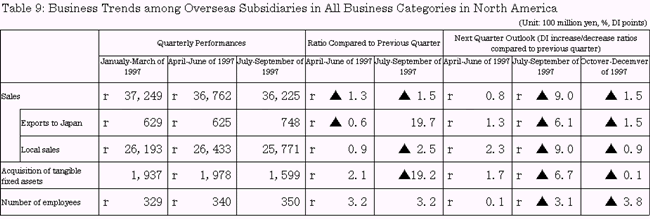
The turnover yielded by locally-based overseas subsidiaries located in North America registered 3 trillion 622.5 billion yen, a 1.5% decline compared to the previous quarter. By category, the declined turnover was witnessed in five categories represented by transportation equipment and industrial machinery , while the remaining eight categories enjoyed increased sales. Transportation equipment was a major negative contributor to the overall decline in sales, leading to a 12.1% decline compared to the previous quarter and declined sales amounting to 100.7 billion yen.
Local sales amounted to 2 trillion 577.1 billion yen, a 2.5% decline compared to the previous quarter. The composition ratio of locally-made sales in the turnover (total sales) was 71.1%, a decline of 0.8% compared to the previous quarter.
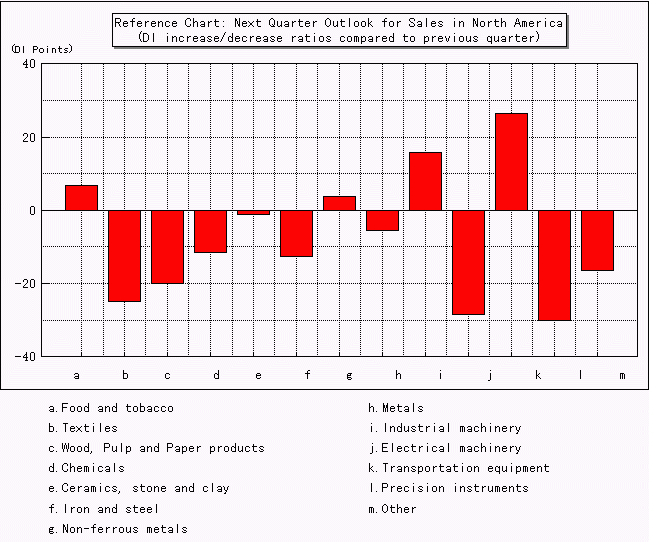
The outlook for projected sales in the October-December quarter was favorable with a growth prediction, namely, the DI index came out with 42.1 points on a total basis. Favorable sales increases were forecast by all the business categories excluding textiles. While the number of the companies that predicted growth in sales compared with the previous outlook in the July-September quarter slightly decreased (minus 1.5 points), there was an indication of recovery in future sales, judging from the significantly improved outlook presented by the transportation equipment sector that suffered heavy declines in the past.
Likewise, the outlook for locally-made sales in the coming quarter also depicted a bright future for local sales in all business categories aside from textiles with a total DI index of 42.0 points. It is worthy of note how the next quarter outlook improvement will turn out in the transportation equipment sector.
(b) Facility Investment
The amount of acquired tangible fixed assets excluding land was 159.9 billion yen, a 19.2% decline compared to the previous quarter. The reduced amount in the acquisition of tangible fixed assets in the transportation equipment and electrical machinery sectors was the major factor that caused the facility investment amount to decline. By category, the number of business categories that reduced their amount of tangible fixed asset acquisition was eight, while five categories increased their investment amount.
The outlook for the acquisition of tangible fixed assets in the October-December quarter showed a DI index of 24.5 points on a total basis (minus 0.1 point compared to the previous quarter), leading to a growth prediction in all business categories.
(c) Employment
The employees employed by locally-based Japanese overseas subsidiaries located in North America numbered 350,000, which was a 3.2% increase over the previous quarter. The businesses that lost percentage points were only iron and steel and wood and pulp.
(d) Reverse Imports
The imports to Japan or what are known as "reverse imports" amounted to 74.8 billion yen, a 19.7% increase over the previous quarter. Food and tobacco and electric machinery were the largest contributors in raising the across-the-board level.
(2) Asean 4
(a) Turnover and Local Sales
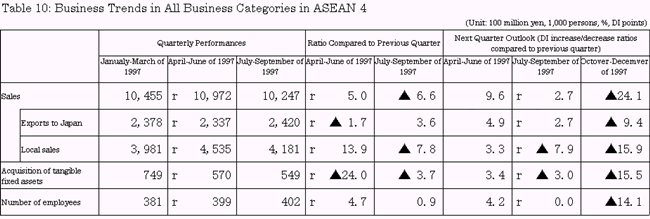
The turnover achieved by locally-based Japanese overseas subsidiaries located in ASEAN 4 countries amounted to 1.247 trillion yen, which was a 6.6% decline compared to the previous quarter. By category, the ten businesses represented by transportation equipment were the losers, while three businesses such as industrial machinery were the winners. The locally-made sales registered 41.8 billion yen, a 7.8% decline compared to the previous quarter. The business categories that lost percentage points numbered 11. The transportation equipment category continued to be the largest loser as well as the negative contributor that caused the across-the-board business performances from the previous quarter to deteriorate.
The October-December quarter outlook for turnover or total sales generated a DI index of 27.2 points on a total basis (minus 24.1 points compared to the previous quarter).Although a continuous growth prediction was forecast in all the business categories excluding transportation equipment, the growth rate was significantly lowered. The outlook for local sales emerged with a DI index of 14.7 points on a total basis (minus 15.9 points compared to the previous quarter), the number of companies that foresaw increased local sales in the coming quarter decreased as in the case of the turnover forecast.
The current business performances of locally-based overseas subsidiaries of Japanese origin in ASEAN 4 countries encountered the largest reductions both in the total sales and in the local sales as compared to the previous quarter. Also, the reductions in the predicted growth rates in the October-December quarter outlook for both total sales and local sales were the largest. The stagnated domestic demand as represented by the slump in the transportation equipment industry attributable to the monetary crisis was assumed to be the major cause for such a negative prediction.
Looking at the sales of Japanese overseas subsidiaries in ASEAN 4 countries by country, the reduction in Thailand, which was the largest, caused to reduce the overall sales significantly on a combined basis of ASEAN four countries. The October-December quarter outlook for the coming quarter sales predicted significant reductions in all the four countries, especially the reduction was reported to be large in Indonesia.

(b) Facility Investment
The acquisition of tangible fixed assets excluding land amounted to 54.9 billion yen, a 3.7% decline over the previous quarter. The slump in the sectors of industrial machinery and textiles were the major culprits for the deterioration in the overall performance.
The October-December quarter outlook for the future acquisition of tangible fixed assets generated a DI index of 9.2 points on a total basis (minus 15.5 points compared to the previous quarter). However, the number of companies that predicted increased investment decreased.
(c) Employment
The employees on the payroll of the locally-based overseas subsidiaries in ASEAN four countries numbered 402,000, which was a slight increase of 0.9% over the previous quarter.
The October-December quarter outlook for employment emerged with a DI index of 6.4 points on a total basis (minus 14.1 points compared to the previous quarter), but the number of the companies that predicted future increase in employment decreased.
(d) Reverse Imports
The sales to Japan or what are so-called reverse imports amounted to 242 billion yen, a 3.6% increase over the previous quarter. The increased sales to Japan were witnessed in five business categories, especially the growth rate was large in the electrical machinery industry.
Looking at the outlook for sales to Japan in the coming October-December quarter, a growth pattern was envisioned with a positive DI index of 16.9 points on a total basis (minus 9.4 points compared to the previous quarter), but the companies that predicted growth in this area decreased in number.
(3) Nies 3
(a) Turnover and Local Sales
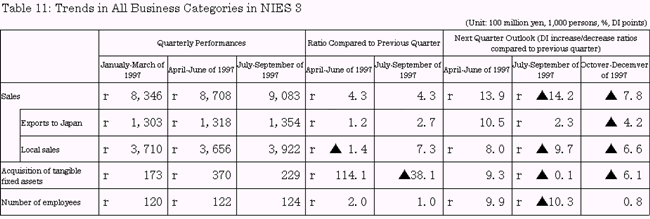
The turnover generated by the locally-based overseas subsidiaries of Japanese origin located in NIES 3 countries increased to 908.3 billion yen, a 4.3% increase over the previous quarter. By category, nine categories represented by electrical machinery increased their sales, while three categories such as textiles were the losers. The locally-made sales also increased to 392.2 billion yen, a 7.3% increase over the previous quarter. Ten categories such as non-ferrous metals increased their local sales, while two categories such as textiles failed to do so.
The October-December quarter outlook for sales yielded a DI index of plus 14.8 points on a total basis (minus 7.8 points compared to the previous quarter). While the width in the overall growth prediction narrowed, five business categories such as transportation equipment and textiles showed improvement in their outlook. The outlook for local sales diminished the prospect of growth in local sales, demonstrating a DI index of plus 13.3 points (minus 6.6 points compared to the previous quarter) on total basis. However, an improved outlook was witnessed in five categories as similarly seen in the turnover performance.
For reference, looking at the turnover of the overseas subsidiaries of Japanese origin in NIES 3 countries by country, Singapore was a significant contributor in raising the overall turnover performance in comparison with the previous quarter performance. Regarding the October-December quarter outlook for sales by country, it was characteristic that the growth prospect significantly diminished as witnessed in Korea where the DI index fell to minus 16.2 points as compared to the previous quarter and likewise in Singapore where the DI index also declined to minus 14.6 points.

(b) Facility Investment
The acquisition of tangible fixed assets excluding land significantly decreased to 22.9 billion yen, a 38.1% decline over the previous quarter. The heavy reduction was largely attributable to the poor performances by the electrical machinery and textiles categories.
The October-December quarter outlook for facility investment came out with a meager DI index of plus 7.4 points (minus 6.1 points compared to the previous quarter) and the companies that predicted future growth diminished.
(c) Employment
The number of employees on the payroll slightly increased by 1.0% over the previous quarter, numbering 124,000 in total.
The October-December outlook for employment remained almost at the same level with a meager positive DI index of 0.5 points on a total basis (plus 0.8 point compared to the previous quarter), but the companies that envisioned future growth in employment increased.
(d) Reverse Imports
The sales to Japan or what are so-called reverse imports slightly increased to 135.4 billion yen, a 2.7% increase over the previous quarter. Six categories increased their sales to Japan. Especially, the industrial machinery category was the largest earner.
The October-December quarter outlook for sales to Japan forecast with a DI index of 5.6 points (minus 4.2 points compared to the previous quarter) that the number of the companies that predicted increases in sales to Japan decreased.
(4) China and Other Asian Countries
(a) Turnover and Local Sales
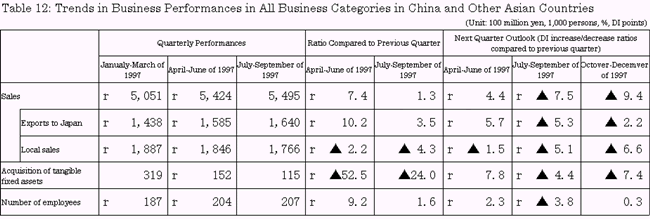
The turnover generated by the locally-based overseas subsidiaries of Japanese origin increased to 549.5 billion yen, a 1.3% increase over the previous quarter. By business category, seven categories such as industrial machinery increased their sales, while six categories such as transportation machinery decreased.
The local sales decreased to 176.6 billion yen, a 4,3% decline over the previous quarter. Seven categories such as electrical machinery decreased their local sales, while five categories such as industrial machinery increased.
The October-December quarter outlook for sales came out with a DI index of 48.7 points (minus 9.4 points over the previous quarter) on a total basis and the prospect of growth in sales diminished in nine categories.
Also, the same quarter outlook for local sales indicated the reduced growth prospect with a DI index of 41.0 points (minus 6.6 points compared to the previous quarter), but six categories envisaged an improved outlook as seen in the case of the turnover outcome.
For reference, looking at the sales generated in China when divided into Hong Kong and other areas, although no noteworthy changes in sales were witnessed in Hong Kong after the July reversion of Hong Kong to China, it is worth noticing that the companies that predicted increases in sales in the coming October-December quarter further diminished.

(b) Facility Investment
The acquisition of tangible fixed assets excluding land significantly decreased to 11.5 billion yen, a large decline of 24.0% over the previous quarter. Chemicals and electric machinery were the major culprits for the heavy decline in the acquisition of tangible fixed assets.
The October-December quarter outlook showed a DI index of 20.8 points (minus 7.4 points compared to the previous quarter) on a total basis. The companies that saw the facility investment to grow in the future decreased, but five categories saw improvement ahead.
(c) Employment
The number of employees slightly increased by 1.6% over the previous quarter. The October-December quarter outlook for employment that yielded a DI index of 31.8 points (plus 0.3 points compared to the previous quarter) indicated a slight increase in the number of companies that predicted increased employment in the next quarter.
(d) Reverse Imports
The sales to Japan or what are so-called reverse imports increased to 164 billion yen, a 3.5% increase over the previous quarter. Eight categories increased their sales to Japan, especially the electrical machinery and industrial machinery sectors increased considerably.
The October-December quarter outlook for sales to Japan yielded a DI index of 25.6 points on a total basis (minus 2.2 points compared to the previous quarter), which indicated that the companies that saw growth in sales ahead decreased.
(5) Europe
(a) Turnover and Local Sales
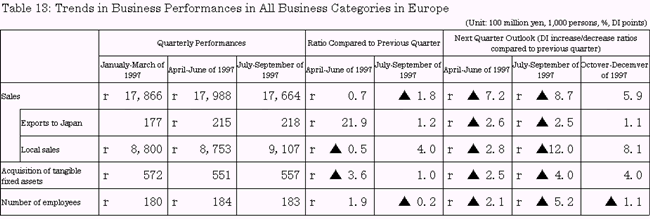
The turnover yielded by the locally-based overseas subsidiaries of Japanese origin slightly fell to 1 trillion 766.4 billion yen, which was a 1.8% decline over the previous quarter. By category, eight categories represented by transportation equipment were the losers and four categories such as electrical machinery were the winners. The reduced sales in the transportation equipment category was a major reason for having deteriorated the overall business performances.
The local sales increased to 910.7 billion, which was a 4.0% increase over the previous quarter. Four categories such as electrical machinery increased their local sales, while eight categories such as transportation equipment decreased their local sales. The increased sales in the electrical machinery category was a major benefactor.
The October-December quarter outlook for sales indicated with a DI index of 43.0 points (plus 5.9 points compared to the previous quarter) that the prospect of growth increased in seven categories. By the same token, the outlook for local sales increased the prospect of growth with a DI index of 44.3 points (plus 8.1 points compared to the previous quarter).
(b) Facility Investment
The acquisition of tangible fixed assets excluding land slightly increased to 55.7 billion yen, an increase of 1.0% over the previous quarter. The huge increase in the facility investment in the electrical machinery sector was more than large enough to offset the reductions in nine categories such as industrial machinery.
The October-December quarter outlook for facility investment resulted in the slightly increased number of companies that saw increased investment ahead on a total basis with a DI index of 19.1 points (plus 4.0 points compared to the previous quarter).
(c) Employment
The number of employees slightly decreased to 183,000, a 0.2% decrease over the previous quarter. The October-December quarter outlook forecast a slight decrease in the number of companies that saw increased employment ahead decreased with an DI index of 6.2 points (minus 1.1 points compared to the previous quarter).
(d) Reverse Imports
The sales to Japan or what are so-called reverse imports slightly increased to 21.8 billion yen, a 1.8% increase over the previous quarter. Eight categories lost percentage points. The two categories of chemicals and ceramics, stone and clay enjoyed larger increases than the others.
The October-December quarter outlook for sales to Japan revealed with a DI index of 2.8 points (plus 1.1 points compared to the previous quarter) that the number of companies that predicted growth in sales to Japan in the future increased.
