

- Statistics

- Quarterly Survey of Overseas Subsidiaries

- Quarterly Survey of Japanese Business Activities(July-September 1998)

- Status of Overseas Subsidiaries by region
Quarterly Survey of Overseas Subsidiaries
Status of Overseas Subsidiaries by region
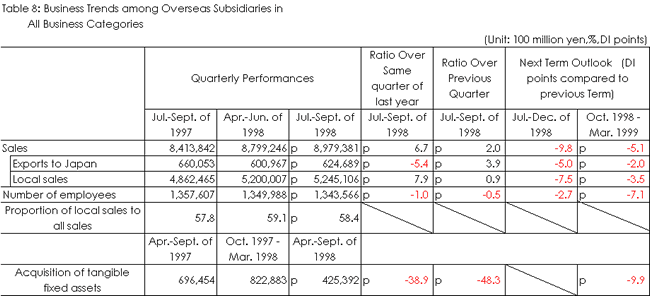
Sales totaled 8 trillion and 979.4 billion yen, up by 6.7% compared to the same period of the previous year, continuing to increase on a year-on-year basis for four periods in a row.
Exports to Japan, or so-called reverse imports, totaled 624.7 billion yen, down by 5.4% compared to the same period of the previous year, decreasing on a year-on-year basis for three consecutive periods.
In regard to acquisition of tangible fixed assets except land, the amount totaled 425.4 billion yen, down by 38.9% year-on-year, decreasing in eleven industries other than precision machinery industry and other industries.
In light of comparison of DI with the previous period concerning sales prospect for October 1998-March 1999, the figure is 4.2 points up for North America and 1.7 points up for Europe, meaning that the percentage of overseas subsidiaries forecasting a rise in sales is increasing in these areas. In total, however, the figure is down by 5.1 points from 17.2 to 12.1.
- (i)Total and local sales
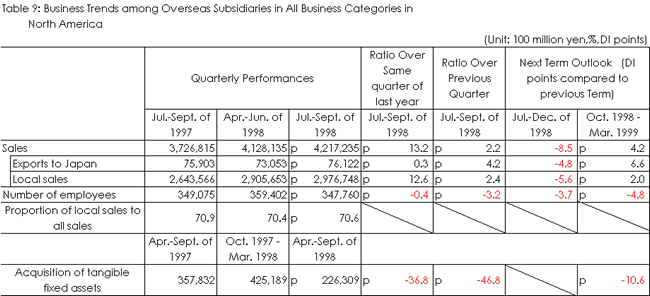
- Total sales reached 4 trillion and 217.2 billion yen, up by 13.2% on a year-on-year basis, increasing in all industrial classifications. In terms of business categories, transport machinery (up 12.1% year-on-year) and electrical machinery (up 11.7% year-on-year) distinctively contributed to the sales increase.
- Regarding local sales, increases have been recorded in all industrial classifications totaling 2 trillion and 976.7 billion yen, up by 12.6% compared to the same period of the previous year.
- In light of comparison of DI with the previous period concerning the sales prospect for October 1998-March 1999, the figure was 4.2 points up from 19.7 to 23.9 for total sales and 2.0 points up from 21.3 to 23.3 for local sales, meaning that the percentage of overseas subsidiaries forecasting a rise in both sales is increasing.
- (ii)Equipment Investments
- Acquisition of tangible fixed assets except land totaled 226.3 billion yen, down by 36.8% compared to the same period of the previous year, decreasing in eight industrial classifications like electrical machinery. In light of comparison of DI with the previous period concerning the prospect for October 1998-March 1999, the figure is 10.6 points down from 21.8 to 11.2, meaning that the percentage of overseas subsidiaries forecasting a rise in acquisition of tangible fixed assets is decreasing.
- (iii)Employment conditions
- The number of employees was 348,000, down by 0.4% from the same period of the previous year.
- In light of comparison of DI with the previous period concerning employment conditions for October 1998-March 1999, the figure is 4.8 points down from 6.2 to 1.4, which means that the percentage of overseas subsidiaries forecasting an increase in the number of employees is on the decline.
- (ix)Reverse imports
- Exports to Japan, or so-called reverse imports, were up in eight industrial classifications, including electrical machinery, reaching 76.1 billion yen, up by 0.3% compared to the same period of the previous year.
- (i)Total and local sales
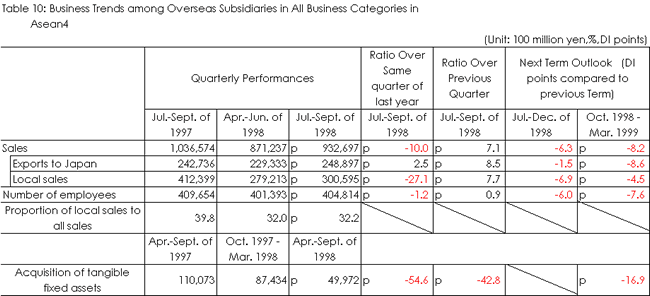
- Total sales was 932.7 billion yen and local sales was 300.6 billion yen, down by 10.0% and 27.1% respectively compared to the same period of the previous year, both decreasing largely on a year-on-year basis for four consecutive periods. In terms of business categories, both total and local sales decreased in six industrial classifications like transport machinery.
- In light of comparison of DI with the previous period concerning the prospect for October 1998-March 1999, the figure was 8.2 points down from 9.1 to 0.9 for total sales and 4.5 points down from 1.6 to -2.9 for local sales. Regarding both categories, the percentage of overseas subsidiaries forecasting a rise in sales is decreasing in six business categories.
- (ii)Equipment Investments
- Acquisition of tangible fixed assets except land totaled 50 billion yen, down by 54.6% compared to the same period of the previous year, decreasing in all the industrial classifications.
- In light of comparison of DI with the previous period concerning the prospect for October 1998-March 1999, the figure is 16.9 points down from 8.5 to -8.4, meaning that the percentage of overseas subsidiaries forecasting a rise in acquisition of tangible fixed assets is significantly decreasing.
- (iii)Employment conditions
- The number of employees was 405,000, down by 1.2% from the same period of the previous year.
- In light of comparison of DI with the previous period concerning employment conditions for October 1998-March 1999, the figure is 7.6 points down from -3.7 to -11.3 and the percentage of overseas subsidiaries forecasting a decrease in the number of employees is increasing even more sharply than the previous period.
- (ix)Reverse imports
- Exports to Japan, or so-called reverse imports, were 248.9 billion yen, up in seven industrial classifications, including general machinery, increasing by 2.5% compared to the same period of the previous year.
- In light of comparison of DI with the previous period concerning reverse imports for October 1998-March 1999, the figure is 8.6 points down from 2.9 to -5.7 and the percentage of overseas subsidiaries forecasting an increase in reverse imports has been decreasing for five consecutive periods, and this is the first time that DI went down below zero.
- (i)Total and local sales
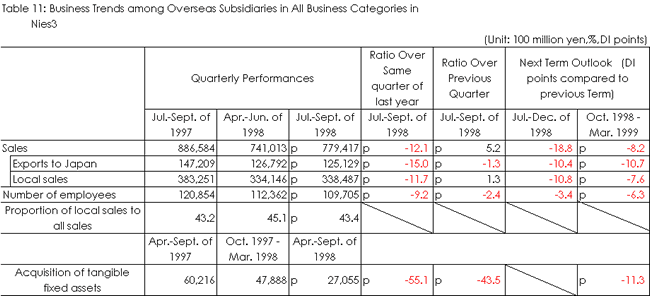
- Total sales were 779.4 billion yen, largely down by 12.1% from the same period of the previous year. In terms of business categories, the sales decreased in nine industrial classifications such as electrical machinery.
- Local sales were 338.5 billion yen, largely decreasing by 11.7% compared to the same period of the previous year. In terms of business categories, the sales decreased in five industrial classifications such as electrical machinery.
- In light of comparison of DI with the previous period concerning the prospect for October 1998-March 1999, the figure was 8.2 points down from -6.6 to -14.8 for total sales and 7.6 points down from -2.1 to -9.7 for local sales, meaning that the percentage of overseas subsidiaries forecasting a rise in sales is significantly decreasing.
- (ii)Equipment Investments
- Acquisition of tangible fixed assets except land totaled 27.1 billion yen, down by 55.1% compared to the same period of the previous year, decreasing in eight industrial classifications like electrical machinery.
- In light of comparison of DI with the previous period concerning the prospect for October 1998-March 1999, the figure is 11.3 points down from 8.6 to -2.7, meaning that the percentage of overseas subsidiaries forecasting a rise in acquisition of tangible fixed assets is significantly decreasing and this was the first time that the DI turned into negative.
- (iii)Employment conditions
- The number of employees was 110,000, down by 9.2% from the same period of the previous year.
- In light of comparison of DI with the previous period concerning employment conditions for October 1998-March 1999, the figure is 6.3 points down from -11.8 to -18.1, with the percentage of overseas subsidiaries that forecast a decrease in the number of employees continuing to increase since the previous period.
- (ix)Reverse imports
- Exports to Japan, or so-called reverse imports, were 125.1 billion yen, down by 15.0% compared to the same period of the previous year, continuing to decrease largely as was the case with the previous period. In terms of business categories, reverse imports decreased in eight industrial classifications, including electrical machinery.
- In light of comparison of DI with the previous period concerning reverse imports for October 1998-March 1999, the figure is 10.7 points down from -11.9 to -22.6 and the percentage of overseas subsidiaries forecasting a decrease in reverse imports has been sharply increasing since the previous period.
(4)China and other Asian countries
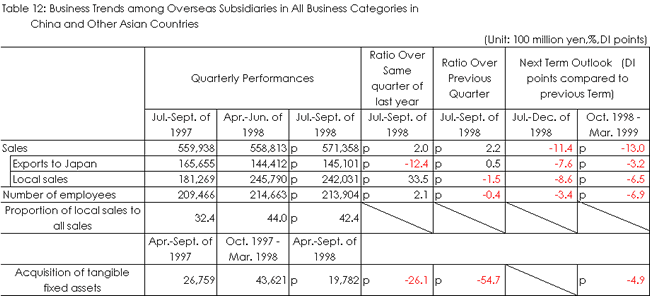
- (i)Total and local sales
- Total sales were 571.4 billion yen, up by 2.0% from the same period of the previous year, increasing in eight industrial classifications such as precision machinery.
- Local sales were 242 billion yen, up by 33.5% compared to the same period of the previous year, increasing in nine industrial classifications like electrical machinery.
- In light of comparison of DI with the previous period concerning the prospect for October 1998-March 1999, the figure was 13.0 points down from 30.9 to 17.9 for total sales and 6.5 points down from 30.5 to 24.0 for local sales, meaning that the percentage of overseas subsidiaries forecasting a rise in sales is decreasing.
- (ii)Equipment Investments
- Acquisition of tangible fixed assets except land totaled 19.8 billion yen, down by 26.1% compared to the same period of the previous year, decreasing in eight industrial classifications like chemical industry.
- In light of comparison of DI with the previous period concerning the prospect for October 1998-March 1999, the figure is 4.9 points down from 12.6 to 7.7, meaning that the percentage of overseas subsidiaries forecasting a rise in acquisition of tangible fixed assets is decreasing.
- (iii)Employment conditions
- The number of employees was 214,000, up by 2.1% from the same period of the previous year.
- In light of comparison of DI with the previous period concerning employment conditions for October 1998-March 1999, the figure is 6.9 points down from 13.0 to 6.1, which means that the percentage of overseas subsidiaries that forecast a increase in the number of employees is decreasing.
- (ix)Reverse imports
- Exports to Japan, or so-called reverse imports, were 145.1 billion yen, largely down by 12.4% compared to the same period of the previous year. In terms of business categories, reverse imports decreased in six industrial classifications, particularly largely in electrical machinery.
- In light of comparison of DI with the previous period concerning reverse imports for October 1998-March 1999, the figure is 3.2 points down from 3.6 to 0.4 and the percentage of overseas subsidiaries forecasting an increase in reverse imports is decreasing.
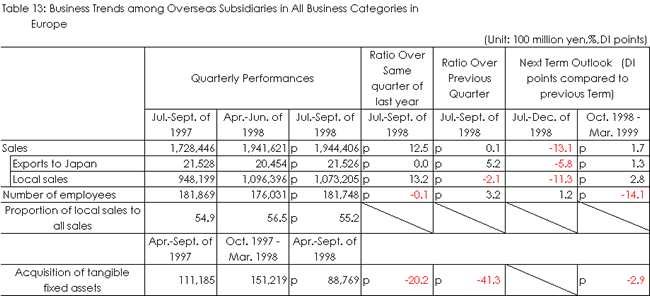
- (i)Total and local sales
- Total sales were 1 trillion and 944.4 billion yen, largely up by 12.5% from the same period of the previous year. In terms of business categories, the sales increased in eight industrial classifications, excluding food and tobacco industry. Especially, increases in electrical machinery and transport machinery contributed largely to the sales increase.
- Local sales were 1 trillion and 73.2 billion yen, largely increasing by 13.2% compared to the same period of the previous year. In terms of business categories, the sales increased in seven industrial classifications such as electrical machinery.
- In light of comparison of DI with the previous period concerning the prospect for October 1998-March 1999, the figure was 1.7 points up from 22.4 to 24.1 for total sales and 2.8 points up from 24.8 to 27.6 for local sales, meaning that the percentage of overseas subsidiaries forecasting a rise in both sales is increasing.
- (ii)Equipment Investments
- Acquisition of tangible fixed assets except land totaled 88.8 billion yen, down by 20.2% compared to the same period of the previous year, decreasing in five industrial classifications like electrical machinery and transport machinery. In light of comparison of DI with the previous period concerning the prospect for October 1998-March 1999, the figure is 2.9 points down from 20.7 to 17.8, meaning that the percentage of overseas subsidiaries forecasting a rise in acquisition of tangible fixed assets is decreasing.
- (iii)Employment conditions
- The number of employees was 182,000, down by 0.1% from the same period of the previous year.
- In light of comparison of DI with the previous period concerning employment conditions for October 1998-March 1999, the figure is 14.1 points down from 12.1 to -2.0, meaning that the percentage of overseas subsidiaries that forecast an increase in the number of employees is significantly decreasing, and this was the first time that the DI went down below zero.
- (ix)Reverse imports
- Exports to Japan, or so-called reverse imports, were 21.5 billion yen, the same as that of the same period of the previous year.
- In light of comparison of DI with the previous period concerning reverse imports for October 1998-March 1999, the figure is 1.3 points up from -6.4 to -5.1, meaning that the percentage of overseas subsidiaries forecasting a decrease in reverse imports is on the decline.
