
- Statistics

- Quarterly Survey of Overseas Subsidiaries

- Quarterly Survey of Japanese Business Activities (Period from January-March 1999)

- Characteristics of the Current Period as Reflected in the Behavior of Overseas Subsidiaries
Quarterly Survey of Overseas Subsidiaries
Characteristics of the Current Period as Reflected in the Behavior of Overseas Subsidiaries
(Period from January-March 1999)
16 July, 1999
Enterprise Statistics Department,
Enterprise Statistics Department,
Research and Statistics Division,
Ministry of International Trade and Industry
Diffusion index on sales (prospects for April-September) for overseas subsidiaries improved in all regions except Europe, particularly in NIES3 and ASEAN4.
- Diffusion index*1 on sales for overseas subsidiaries improved for the second consecutive quarter, up 10.6 points from the previous period (from 17.1 to 27.7).
- The index rose in all regions except Europe. Although it is highest in North America (38.7), the largest increases on the previous period were recorded in NIES3 (up 23.3 points) and ASEAN4 (up 19.3 points).
- The index rose 7.7 points for domestic parent companies, from -22.1 to -14.4.
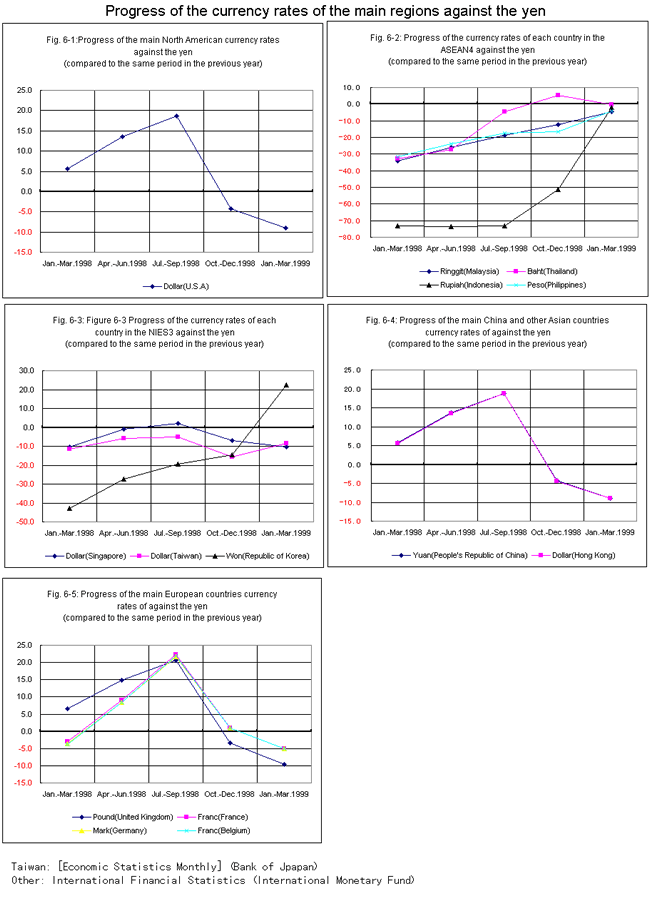
- Sales of overseas subsidiaries declined for the second consecutive period, down 8.9% from the previous year. This may be partly because the U.S. dollar fell 9.0% on the previous year against the yen, and partly because most of the European and other currencies have also depreciated against the yen.*2
- Although sales declined in all regions, the year-on-year decline slowed down substantially in ASEAN4, from -13.1 to -3.0.
Sales of Overseas subsidiaries in the Current Period (Jan-Mar) and Diffusion Index on Sales (Prospects for Apr-Sep)
| Region | D I (prospects for Apr-Sep) Change on previous period (points) |
Year-on-year change in sales (%) |
|
|---|---|---|---|
| Oct-Dec | Jan-Mar | ||
| ASEAN4 | 19.3 ( 6.2 |
- 13.1 | - 3.0 |
| NIES3 | 23.3 (-12.3 |
- 28.1 | - 22.7 |
| North America |
8.9 (29.8 |
- 2.8 | - 7.7 |
| Europe | - 5.9 (25.8 |
5.2 | - 5.2 |
| Total | 10.6 (17.1 |
- 6.2 | - 8.9 |
*ASEAN4(Indonesia, Thailand, Philippines, Malaysia)
*NIES3(Singapore, Taiwan, Republic of Korea)
- *1See DI = Percentage of the companies expecting increase - Percentage of the companies expecting decrease
- Comparison of DI with the previous period = The current DI - The previous DI
- *2See 典rend of Major Currencies against the Yen�on page 3 for changes in the yen-foreign currencies exchange rates.
Although domestic and overseas employment continued to decline, diffusion index (prospects for Apr-Sep) shows some improvement.
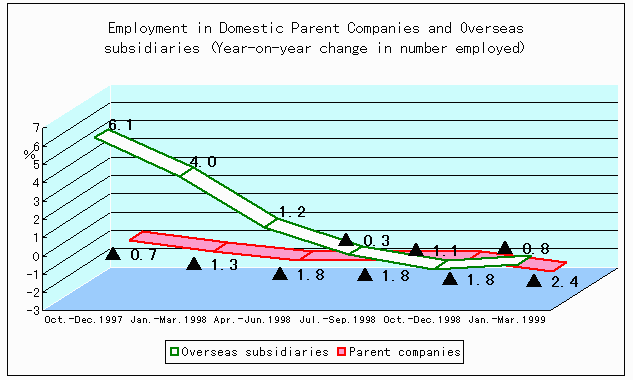
- Employment by overseas subsidiaries, down 0.8% from the previous year, has declined for three consecutive periods since July-September 1998 (-0.3%, -1.1% and -0.8% respectively on the previous year).
- Employment by domestic parent companies has been on the decline, recording the steepest drop since the beginning of this survey (down 2.4% in this period).
- Diffusion index (prospects for April-September) improved on the previous period for both domestic parent companies (from -33.7 to -27.9) and overseas subsidiaries (from -1.7 to 0.6).
- By region, diffusion index for overseas subsidiaries fell 2.3 points (from 2.9 to 0.6) in North America, and 2.0 points (from 1.1 to -0.9) in Europe. In contrast, it rose 9.5 points (from -4.8 to 4.7) in ASEAN4 and 4.2 points (from -18.2 to -14.0) in NIES3. Particularly in ASEAN 4, diffusion index became positive for the first time in four periods.

Transactions between domestic parent companies and overseas subsidiaries (exports and imports) continue to increase their importance.
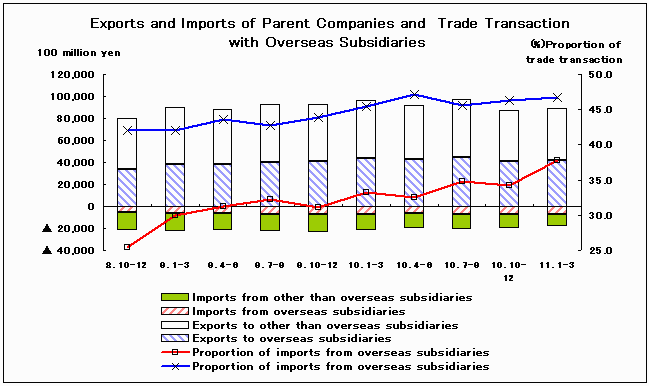
- As regards intra-company trade, exports to, and imports from overseas subsidiaries both declined for the second consecutive period. Exports to overseas subsidiaries in particular recorded a steeper decline than in the previous period.
- However, the share of intra-company trade in total exports and imports of domestic parent companies has been on the rise, with exports to overseas subsidiaries gaining 1.2 points on the previous year (from 45.5% to 46.7%) and imports from overseas subsidiaries rising 4.6 points (from 33.2% to 37.8%).
- Exports from overseas subsidiaries to Japan (reverse exports) continued its steep decline, down 16.4% (19.8% in the previous period).


Last Update: January 31, 2008

 h2c3841e.html


